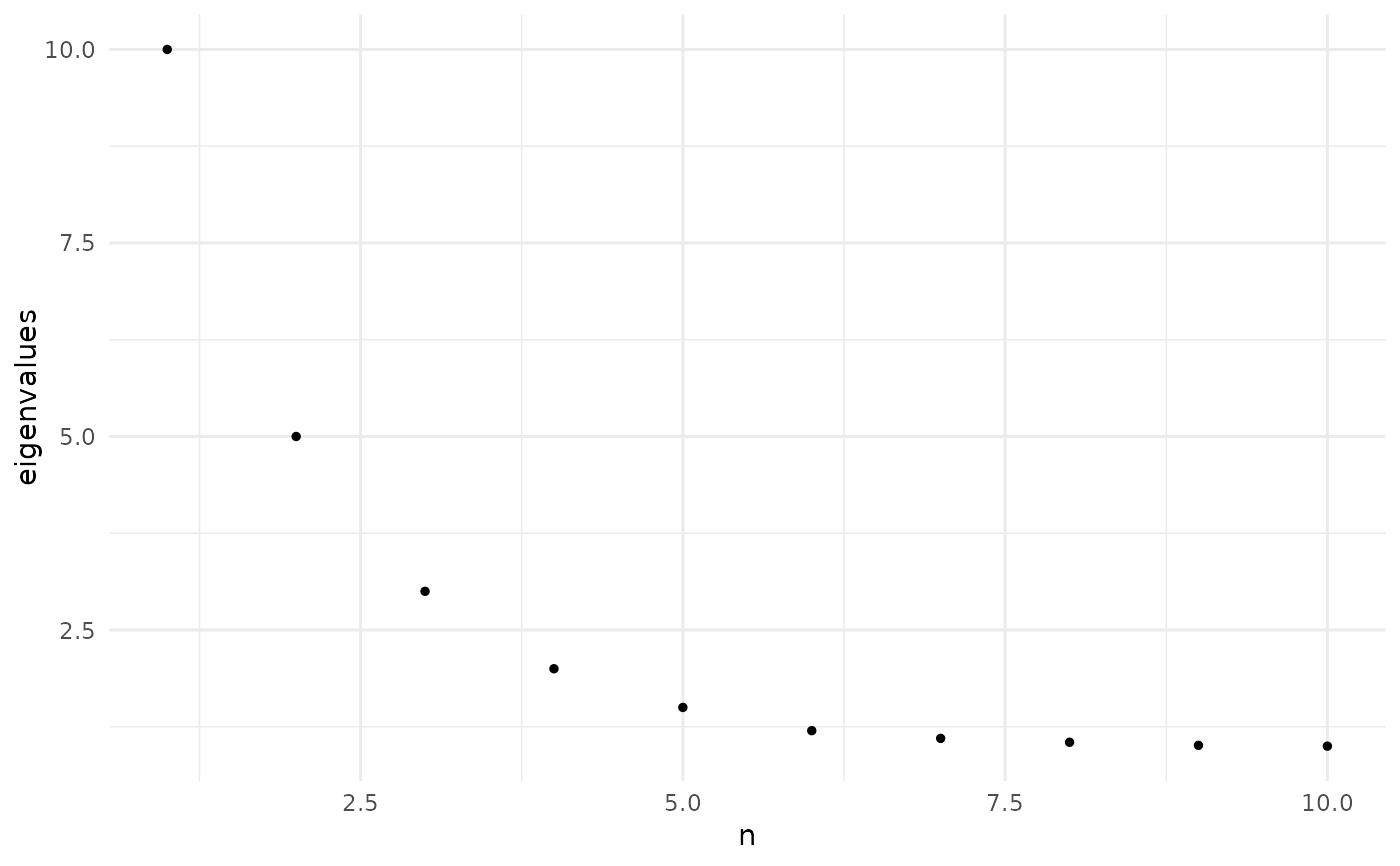
Displays the top eigenvalues as a scatter plot to help visualize the spectral
gap and inform dimensionality selection. The elbow in the scree plot
corresponds to the rank automatically selected by
find_elbow_kneedle.
See also
find_elbow_kneedle for automatic dimensionality
selection from the same eigenvalues.
Examples
# Basic usage
eigenvalues <- c(10, 5, 3, 2, 1.5, 1.2, 1.1, 1.05, 1.01, 1.0)
plot_eigen(eigenvalues)
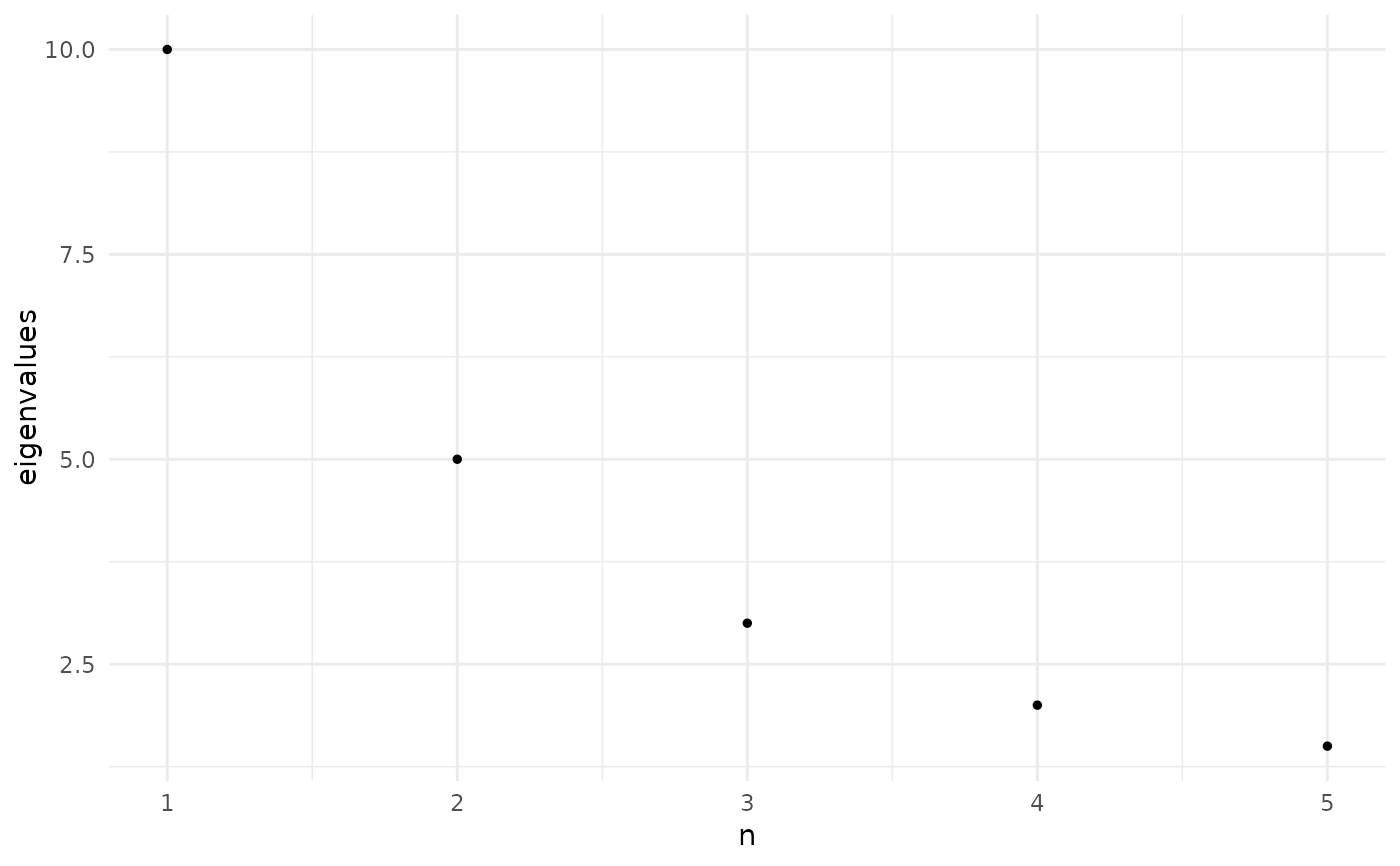
 # Plot only the first 5
plot_eigen(eigenvalues, n = 5)
# Plot only the first 5
plot_eigen(eigenvalues, n = 5)
 if (FALSE) { # \dontrun{
# After running MOSAIC
result <- run_MOSAIC(list(RNA = seurat_rna),
sample_meta = "sample_id",
condition_meta = "condition")
plot_eigen(result$eigenvalues)
} # }
if (FALSE) { # \dontrun{
# After running MOSAIC
result <- run_MOSAIC(list(RNA = seurat_rna),
sample_meta = "sample_id",
condition_meta = "condition")
plot_eigen(result$eigenvalues)
} # }